

There is a logic to the built environment of New York City on the island of Manhattan
Logistical Growth Modeling is a framework used by biologists, physicists, economists, and historians to make sense of, predict, and manage things from corporate sales, epidemics and ecosystems to lasers and urban growth.
Cliometrics is a branch of economics since the 1950s that uses data, science, and long-term trends to “decode” histories traditionally told and accounted for as linear narratives.
I learned about Logistical Growth Modeling and Cliometrics a few months ago while researching a post. Though “complexity science” is at the heart of both, they offer easily understood, basic concepts about how the world works. I don’t think I “stumbled” onto LGM and Cliometrics, it’s just what I found at the “end of the road.” Beyond New York history, LGM has made me see things differently, but for what has been the long time goal of this blog, LGM and cliometrics remarkably make New York City history make remarkable sense.
The relaunch of Manhattan Unlocked in January, 2025 was premature. If you read those posts, I’m sorry for parts that strayed, were unfocused or undeveloped. I will update and edit sections, I think I just needed to start “talking” again at the time.
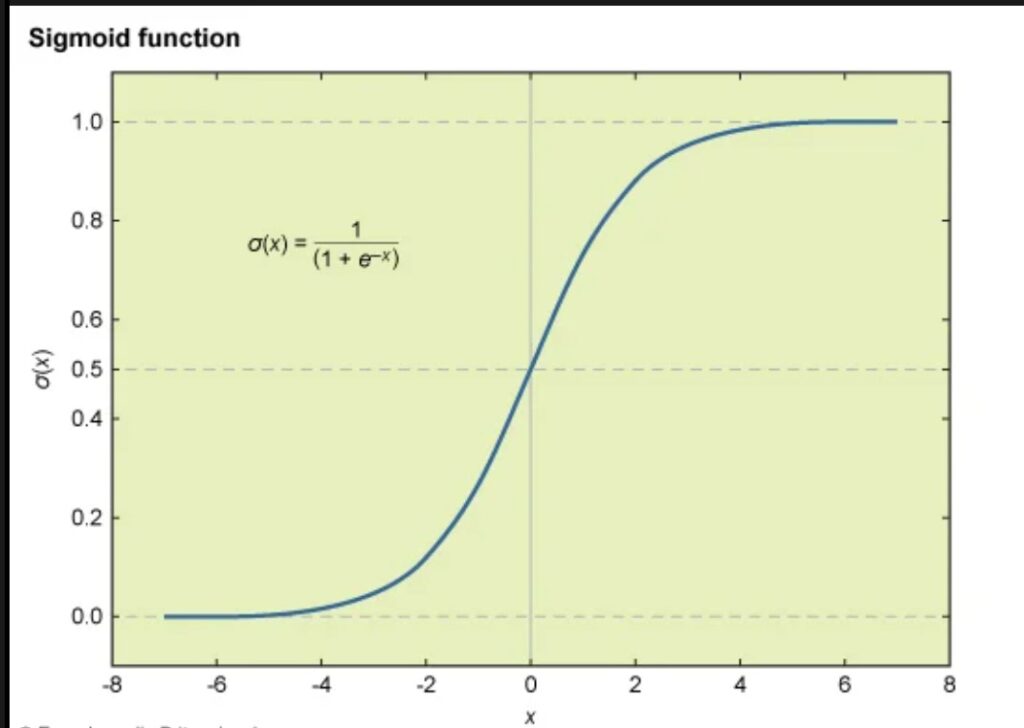
The central idea to Logistical Growth Modeling is the S-curve (Sigmoid Curve) and the inflection point. Together they represent the basic dynamics of how a system grows.
The inflection point occurs when something accelerating very fast, slows down (this is key!!!), and is represented by the mid-point of the S-curve.
From an unchallenged rate of growth, the inflection point is when a system decelerates. Anything growing exponentially fast must slow down, otherwise it would fill the universe, and the inflection point occurs when fast-growing things (epidemics, album sales, populations, ecosystems), slow down. At the inflection point growth changes direction, another important concept that took me a while to appreciate, and what that means is very different for different things.
Up until its inflection point, an exponentially growing system experiences all positive feedback loops; there is virtually no resistance to growth; this stage is represented by the bottom half of the S-curve.
But everything grows into something, and eventually the environment, the “container,” “pushes back” as a system approaches its limits (its ceiling, carry capacity, market saturation, or steady state), represented by the top of the S-curve.
LGM is about the “container and the contained,” and the container/environment can be almost anything. Whatever the ultimate limit of growth, halfway to that limit the container/environment “engages” with growth as early negative feedback loops emerge and build after the inflection point. What’s happening is an “agreement and arrangement” on how they (the container and the contained) will “work together” going forward after the inflection point, if indeed they can work together and growth is to continue. Following the inflection point, a new “arrangement and agreement” kicks in and a slower, more managed rate of a more ordered growth ensues. The container/environment can be an ecosystem, hosts, a market-base, an island or many other things.
The inflection point is an imaginary threshold and boundary a system crosses halfway to its limit, and a new direction of growth begins when the first negative feedback loops emerge and continue to grow while thwarting, re-directing and/or re-shaping growth going forward. The thing about inflection points is, it’s almost impossible to know you’re in one; the sense may be a “vibe shift” as a system starts reacting, responding, and engaging with the limits of its environment.
Before and after the inflection point can be qualitatively different experiences as a system goes from unrestricted free-form growth, to growth by a new set of rules. At the inflection point the internal dynamics of a system undergo a “redirect,” after which growth is more ordered and organized. On the other side of an inflection point, one is on a new path, going in a new direction.
Here’s how the model works in the business world, using the example of a 100-seat restaurant and the concept of “diminishing returns.” Of course, a well- managed restaurant, whose goal it is to turn a profit while keeping its customers happy, is categorically different from urban growth (or an epidemic or a rainforest for that matter), but they share terms for the fascinating ways their operations are analogous. “Diminishing returns” is a refined entrepreneurial idea that refers to the additional “cost” of maintaining the service and profits of a business (here, a restaurant) after its inflection point.
In a 100-seat restaurant, profits will never be easier than the first 50 customers, after which diminishing returns kick-in and grow with each additional customer after #51.
For the first 50 customers, cooks move around easily, stations are easy to maintain, seats are plentiful; efficiency is easy. Customers #51-100, however, pay the same price but “cost” the system more to serve and process. Even before the financial cost of additional staff, small frictions emerge as increasingly cooks bump each other, fewer tables are available, customers wait, stations are harder to keep clean, and maintaining efficiency and keeping things optimal “costs” more in sweat and profits for customers 51-100.
From effortless acceleration to slower growth shaped by resistance, diminishing returns are the “more costly” profits on the right side of the inflection point.
A bifurcation point is another important concept in LGM. If the restaurant adds more seating it raises the carrying capacity and resets the inflection point; if the restaurant adds space over the years, it’s a bifurcation cascade.
As a framework for New York City, LGM brings astonishing order and sense to an inordinately complex history. It also reveals a tragic connection between already well established histories.
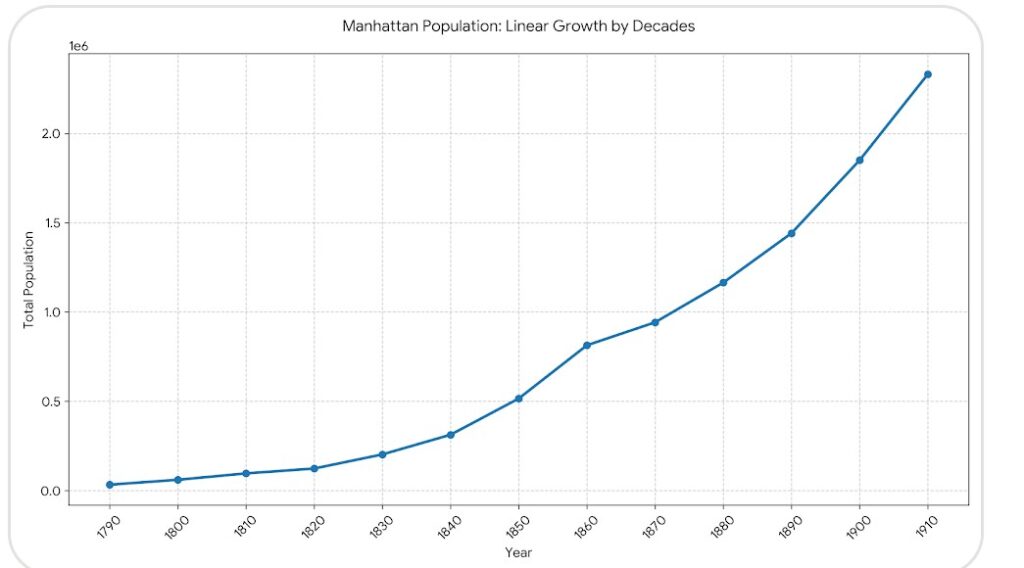
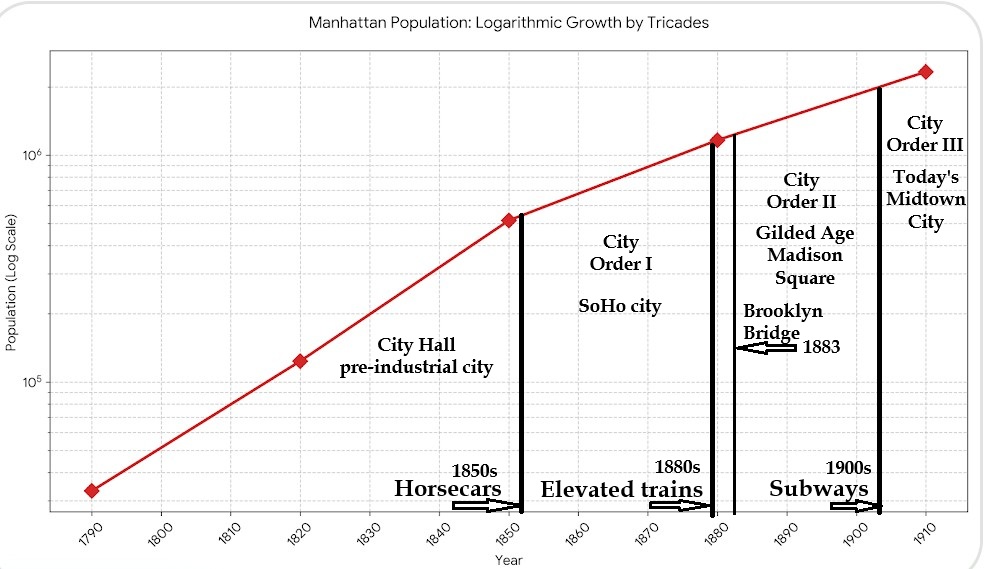
The graph above shows Manhattan’s population growth over 120 years between 1790 and 1910, from 33,000 to 2.3 million, its peak. Population growth on a linear graph shows the number (mass) of people.
The “bump” seen in 1860 marks the concluding decade of the massive Irish and German immigrant waves between 1845-1855. It would take 55 years for the population to climb from 33,000 to 370,000 between 1790 and 1845, then 270,000 largely Famine Irish and German 48ers were added in just 10 years! Important too, that number was out of 2.3-2.5 million who came to port, many of whom disembarked and stayed a short time.
A log (logarithm) graph shows the momentum, or rate of growth. Where the line tilts down (concaves) is the inflection point and shows where the pace of immigration slowed. Another important thing to understand is that at the inflection point, the rate of growth is the fastest it will ever be (…until the next inflection point, of course).
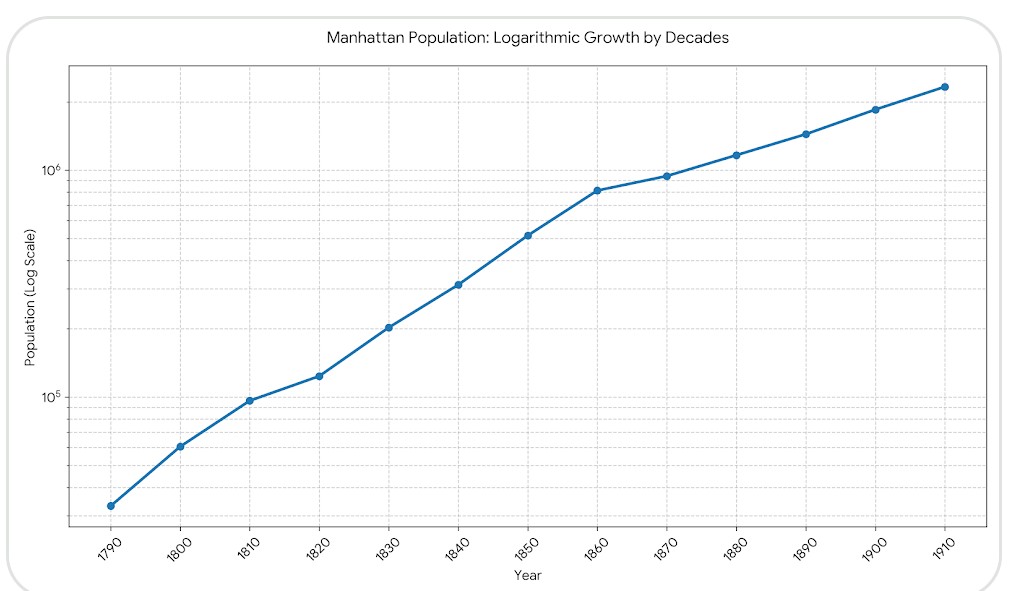
The log graph above shows two inflection points: 1810 and 1860. Let’s consider the first inflection point.
At the end of the Revolutionary War, New Englanders (Yankees), many Scotch-Irish Presbyterians (and the businessmen who would start NYU), tripled the Dutch-English, slave and worker population in 20 years, from 33,000 to 96,000 between 1790 and 1810. Then growth slowed, and an early New York formed with City Hall at its center. This period of New York history is well represented in Kenneth Dunshee’s As You Pass By.
This early New York had an order that conformed to the island’s topography. City Hall was on a large patch of central high ground that was so large, central and high, it was useless for any practical commercial purposes, and without a king to build a castle it was used for the common good.
The high ground patch (that holds the oldest City Hall in the country) is still bordered by Broadway on the west (which originally ended not far beyond), and The Bowery Road (now Park Place) branching east. The original Bowery skirted City Hall’s high ground to the east, and after Chatham Square, rose uptown as the high Bowery Road, but not before passing the Collect Pond to the west. Behind City Hall, Chambers Street dropped quickly down to the water.
Slight but noticeable differences in the street grade is what remains (above ground) of the once massive (in New York real estate terms) Collect Pond wetland ecosystem. Canal Street ran along the bottom of a half-cross-island river valley that sloped up to Chambers Street on the south side, and Grand Street a half mile away uptown on the other. Defensive palisades stood on both high ground streets for the French and Indian, and Revolutionary Wars respectively. West of the Bowery, the wetland extended to the Hudson River and included most of Tribeca.
New York’s East River shore was the “working” side with shipbuilding, and below that the economic engine came in three parts: the South Street Seaport, Wall Street, and their connection through Pearl Street. Shipping, financing and wholesaling. Farmlands east of the Bowery were being developed with artisan “rental” housing, but most everything north of Canal Street was rural. Today’s Financial District and parts of Tribeca held virtually all of the social and commercial cultural components of New York City between the 1790s and 1840s. Upper class residential blocks were along or just off Broadway, and after the 1820s many wealthy moved to “Places” on blocks throughout the East Village today, from Tompkins Square Park, St. Mark’s Place and Second Avenue, to Astor Place and Washington Square.
This early New York would not last long. Massive public works projects planned in the 1810s, the Erie Canal and the grid (both bifurcation points), drew thousands of laborers. In 1818 the Black Ball line provided regular passenger service to Liverpool and brought the Irish especially, but people came from everywhere for the opportunities, and the population began to take off again.
With the opening of the Erie Canal in 1825 and the economic boom that followed, many Irish canal builders settled in New York’s Five Points neighborhood. Between the 1820s and 40s, the rate and pace of New York’s population increased rapidly, and reached 370,000 by 1845; an additional 274,000 people were added in 35 years–274,000, in 35 years.
Then, world events sent the Famine Irish and German “48ers,” and 270,000 people were added in 10 years.
We’re giong to look at the second inflection differently.
To see long-term trends, researchers can “zoom out” on the data by looking at fewer data points. It’s considered a “trade-off between signal and noise;” with less granular data we can see the proverbial “forest for the trees.” When looking at just 7 data points (every 30 years instead of decades), the information gives us a model for a “long term” story and explanation for what happened in New York. In this view, the 1810 inflection point disappears, and the 1860 inflection point shifts to 1850.
This was the graph I looked at and almost immediately 120 years of history made sense.
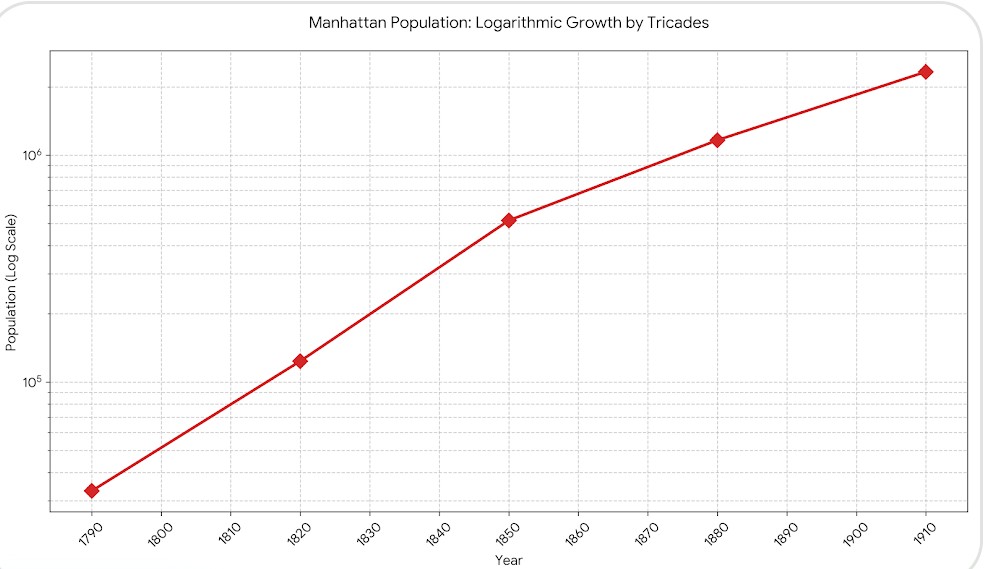
The two sides of the inflection point represent qualitatively different histories. In fact, the first half is quanity and the second half is quality in terms of their directions of growth.
1790-1850 were New York’s Boomtown years. Like the first 50 customers in the 100-seat restaurant, all feedback loops were positive; everyone who wanted to come to New York could be here.
In an epidemic, it’s the fastest growing period before the “curve flattens;” in nature, it’s when a species population explodes; it’s a best-selling album from release to peak sales…all before resources, space, infrastructure, hosts, predators, or markets disappear or “push back.”
Around 1850 the city was growing the fastest it ever would; and the decades leading up to 1850 “ramped up” to its maximum velocity.
The left side of the inflection point represents 60 years of growth, when the city went from 33,000 to 515,000 and the population doubled every 15 years for 60 years, or 4.7% annually. The right side of the inflection point, though more massive, was slower and doubled every 28-30 years for 60 years, or 2.5% annually.
At the inflection point, a system is growing the fastest and “easiest” it ever will. But it means entirely different things for the controlled, managed environment of a profit-seeking restaurant than it does for the growing population of a city, especially one unprepared for the growth that came to New York.
Let’s imagine for a moment what a commercial center like New York might look like–considering for a moment the “zoomed out” lens of history–at the end of 60 years of exponential growth.
- Family businesses would still feel like start-ups after three generations(!), relocating into larger quarters every few years.
- Docks and piers would be in a shambles state with virtually no downtime for repairs; supply chains could never mature.
- Food vendors would be in the streets everywhere for the constant lack of eating houses.
- Transit channels would be chronically clogged with every sort of vehicle and conveyance.
- Chronic housing shortages would see people and families crowding into cellars and converted buildings.
- A new building type might emerge for housing mass numbers of people (a “tenement”).
Of course, these are all hallmark descriptions, and notoriously so, of New York between the 1820s and 50s.
The carrying capacity of a city is the greatest number of people and activity the urban environment can sustain before infrastructure, resources and social systems break down. At a minimum, the carrying capacity of a city is its ability to keep its citizens alive.
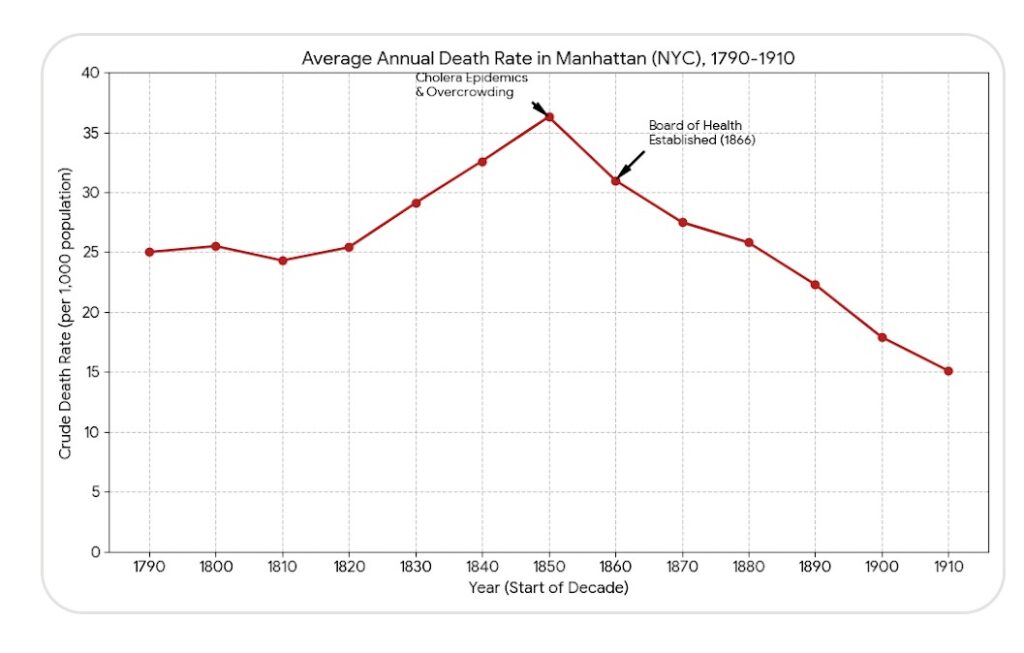
The highest death rate in New York was 1850, 35/1000, numbers seen more often in famine and war. By 1850 New York had not only “overshot” its carrying capacity, it was in a virtual state of collapse.
New York’s inflection point was as much a forced pivot as it was a natural transition. For the first time more people decided not to stay, than stay. Against a crush of people who wanted to be in New York, more said “no thank you, we’ll go somewhere else” for the first time, and New York would never grow as fast ever again.
When an ecosystem overshoots its carrying capacity, food, water, sunlight, air or other resources run low, waste products build-up, and parasites and disease flourish. Along with the “boomtown descriptions” listed above, leading up to 1850 were New York’s worst years for epidemics, fires and riots, it was a time marked by gangs, shantytowns and turf wars. Of course, New York would have these issues after 1850, but they would never be such a preponderance of city life as in the decades leading up to 1850, a time one author described as a “general asylum of vagrants.”
An ecosystem that overshoots its carrying capacity either continues to collapse, or a bifurcation point triggers a “regime shift.” It can be a long-term transition from a forest to savannah, or a short term process triggered by clearing trees or introducing fertilizer and initiating positive feedback loops. In cities, it’s a technological innovation. Both are called bifurcation points, and both lift the carrying capacity of the system.
The greatest, single bifurcation point in city history was likely the Erie Canal. Perhaps the next greatest bifurcation point was Croton Water, arriving in 1842. Of course, the city could not have grown and expanded without the peak engineering used to bring fresh water from 40 miles away to a distributing reservoir at 42nd Street, where the New York Public Library is today.
Before Croton Water, New Yorkers often drank beer to hydrate. Horses from other cities refused New York’s well water. Croton Water would be the lifeline for New York City’s survival. But not before certain detrimental unintended consequences.
Croton Water raised the water table an estimated 10-15 feet through the 1840s. And while flooding basements were a nuisance, it was catastrophic timing for the crushing numbers of Famine Irish who crowded into the cellars and basements in the lowest lying parts of lower Manhattan, especially The Five Points atop the old Collect Pond.
Jacob Riis came with his camera in the 1890s; 50 years earlier it was through lectures, discourse and society meetings that awareness of the worst conditions of the poor was disseminated among those with the power and agency to affect change.
New York’s long-standing black population, and the later arriving Irish, and then the Famine Irish, crowded into the cheapest rents on the cheapest lands—often basements in the lowest lying situations.
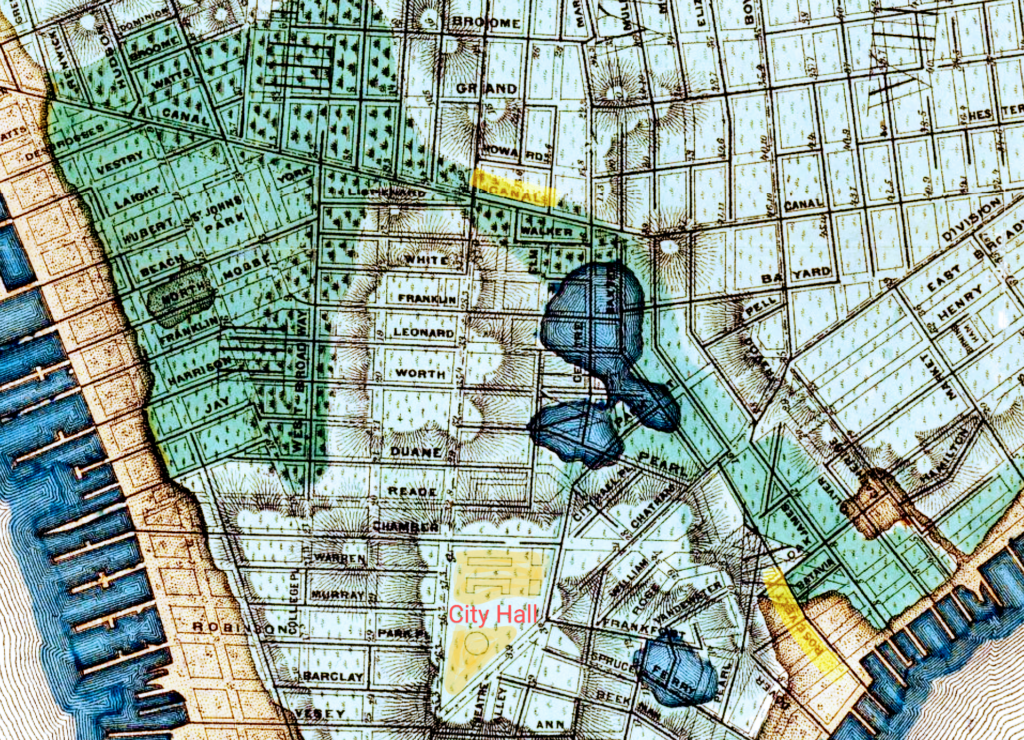
When celebratory fountains of Croton Water shot dozens of feet in the air on the high ground of City Hall in 1842, a thousand feet to the north was The Five Points, dozens of feet below City Hall in elevation. Proper sewers and storm drains came sporadically to downtown districts in the ensuing years, and the water table rose atop Manhattan’s impermeable bedrock throughout the Collect Pond’s old wetland ecosystem blocks.
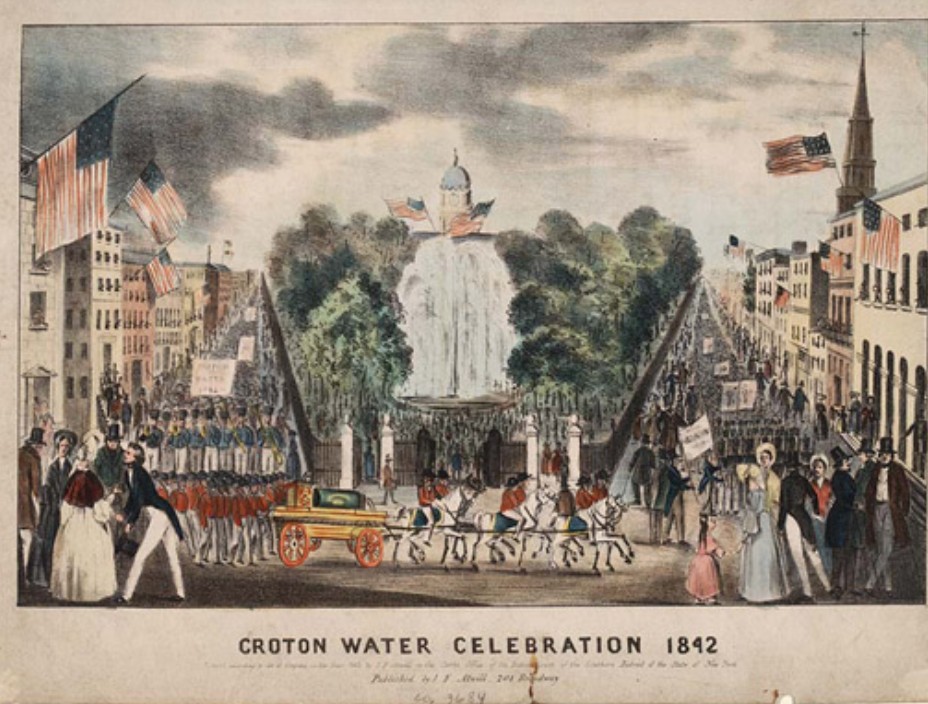
Above: Croton Water Celebration, 1842, City Hall.
Below: Viele map showing the proximity between City Hall and the Collect Pond directly north, the location of The Five Points neighborhood.
Over the early decades of the 19th Century, water well levels dropped, and cellars and basements filled with inhabitants. History books talk of the benefits of Croton Water of course. I’ve read a few that mention the rising water table, and the only complaints were basement flooding. It’s very likely though, the water that contributed to the spread of cholera, typhoid and dysentery–all water borne diseases–that tore through the population through the second half of the 1840s and peaked in 1850, didn’t need to enter the basements, the damp was enough.
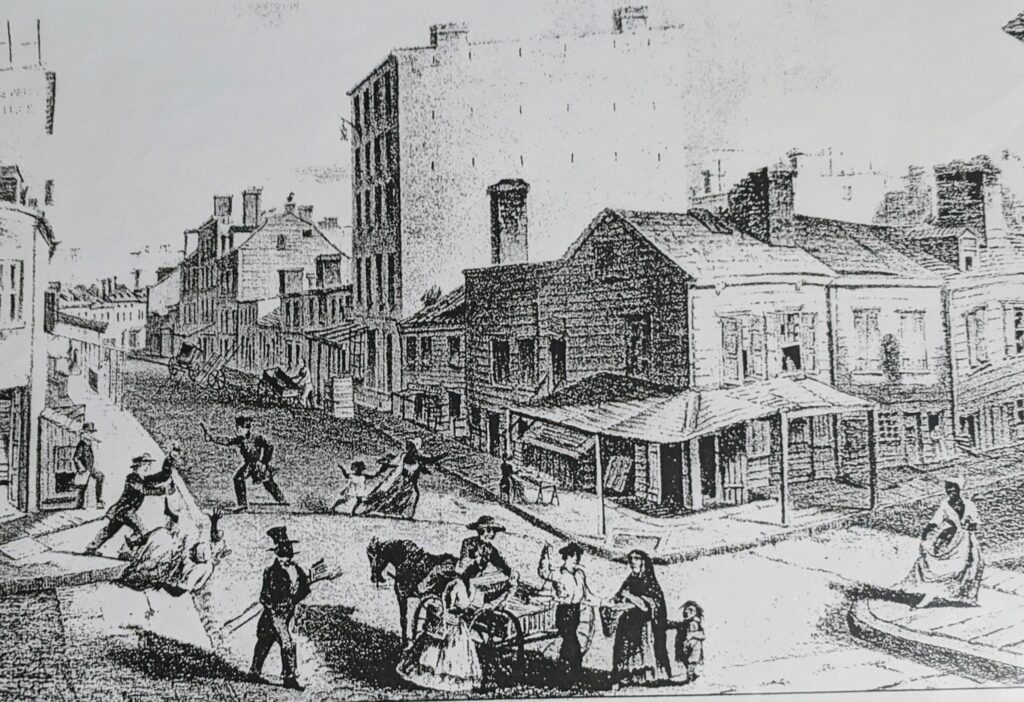
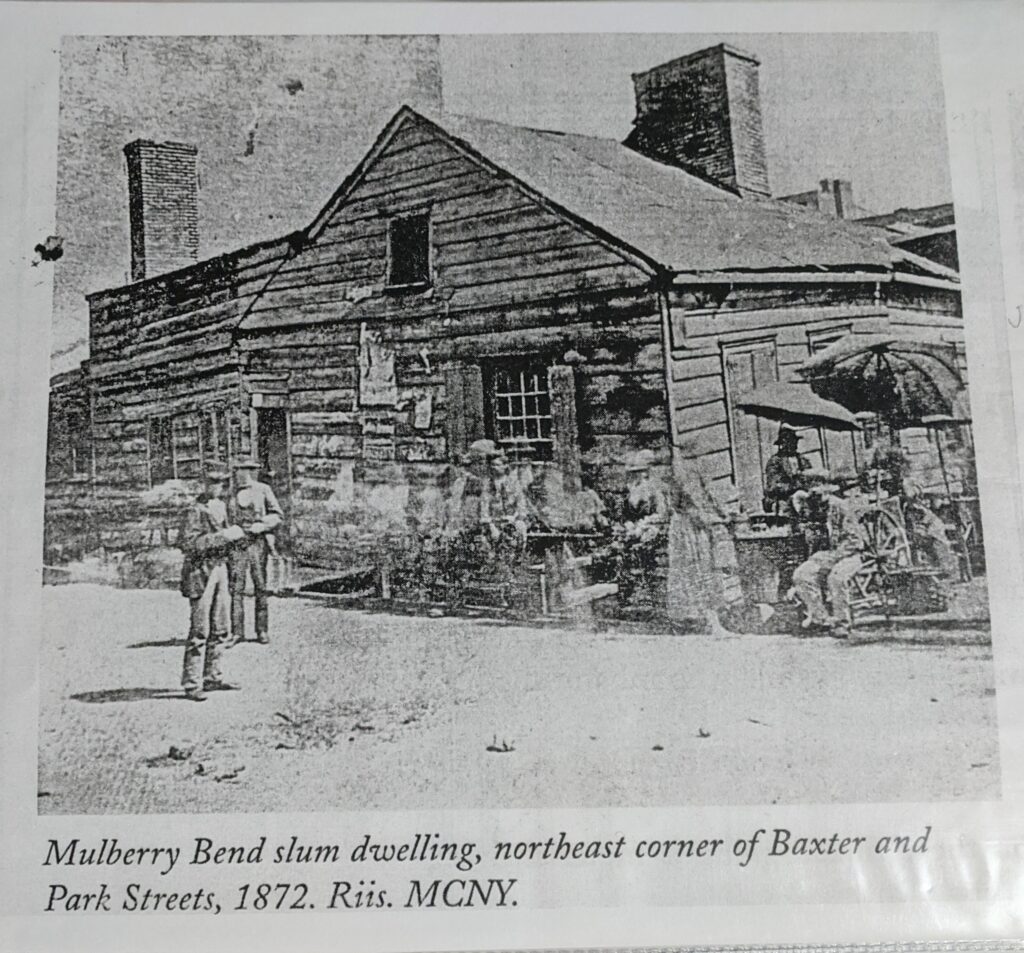
Images I’ve been showing on my tours for years speak directly to the tragic history. Parts of The Five Points by 1872 were at least 10 feet below Mulberry Bend. The difference between The Five Points and Mulberry Bend was the Civil War, a demographic shift from Irish to Italian, and landfill. They were not just the same neighborhood, they were the same block, two sides of today’s Columbus Park.
Three images below show the same house, once at a location now inside Columbus Park, lose its first floor to landfill over 50 years between 1827 and 1872.
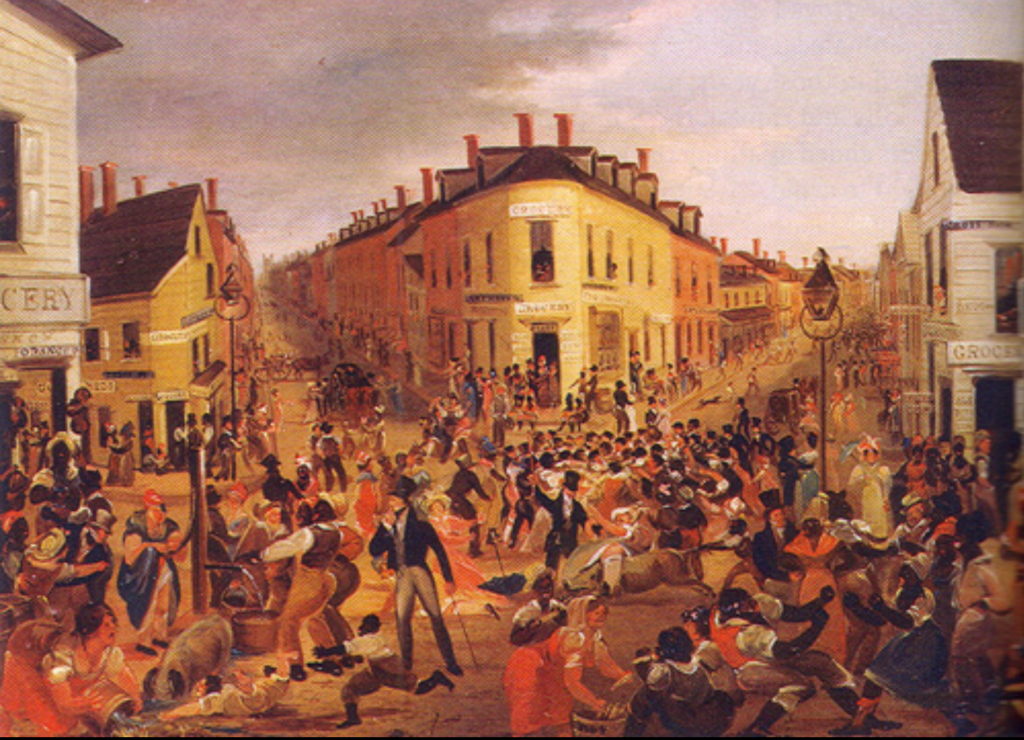
Above. 1827, The Five Points. The building at the far right once stood at the corner of Cross and Orange Streets.
Below left: 1859, the structure has acquired an awning.
Below right: 1872, the neighborhood is now Mulberry Bend, and the first floor of the building is buried in landfill.
The technological bifurcation that reversed the death rate, raised the city’s carrying capacity, and ushered in a new order of development was the horse car lines of the early 1850s.
The answer to why New York City looks the way it does, is, when it comes down to it, people simply couldn’t live further than they could walk to work. But even with horsecars, elevated trains and the first subways, it wasn’t until the 1910s that Manhattan’s population declined for the first time, and not until the 1920s that enough subway service (with the Dual Contract) saw the Lower East Side rapidly depopulate, and Italians went to Brooklyn and Eastern European Jews went to the Bronx.
Combined, MetroNorth, LIRR and New Jersey Transit cover an area larger than Vermont, an iron spiderweb covering some 10,000 square miles with Midtown Manhattan at its center started with horsecar lines that brought people to work each day from Yorkville and Hells Kitchen to SoHo and Wall Street.
Horse cars were the first in a bifurcation cascade of transit systems, and the smallest domino is a scaling up of transit technologies that repeatedly raised the carrying capacity of the city. This begins the history to the right side of the inflection point. But let’s look at the inflection point itself.
Instead of continuing to collapse, New York went through a regime shift and took on a new order. At the time of the city’s highest death rate, the population growth rate slowed, crossed a threshold, and the system–the city–transformed. A new order came to New York City in the 1850s; both on and off the grid, the city resolved into an embryonic blueprint of the city we see today.
Across the 6 miles of Manhattan from the Battery to Central Park, here are the transformations underway in the single decade of the 1850s:
- 1858, Central Park is created. Vaux and Olmstead win the Central Park plan competition with the Greensward Plan.
- 1851, “Above Bleecker!” is the refrain of the wealthy and they move into brownstone homes on Fifth Avenue in Madison Square along with clubs and hotels.
- 1854, The Academy of Music is established near the SW corner of Union Square and the beginning of Broadway’s diagonal run.
- 1850s, upper class retailers gather on Broadway between Grand and Houston Streets: Lord & Taylor and Brooks Brothers move from the waterfront and the Bowery; Tiffany’s moves from City Hall. Arnold Constable had been at Broadway and Canal Street since 1826.
- 1851, Tribeca gets its first “warehouses” in the form of cast iron store-and loft buildings.
- 1853, The Trinity Building is the first “office building” in the Financial District.
- 1855, Castle Gardens is converted to an immigrant depot.
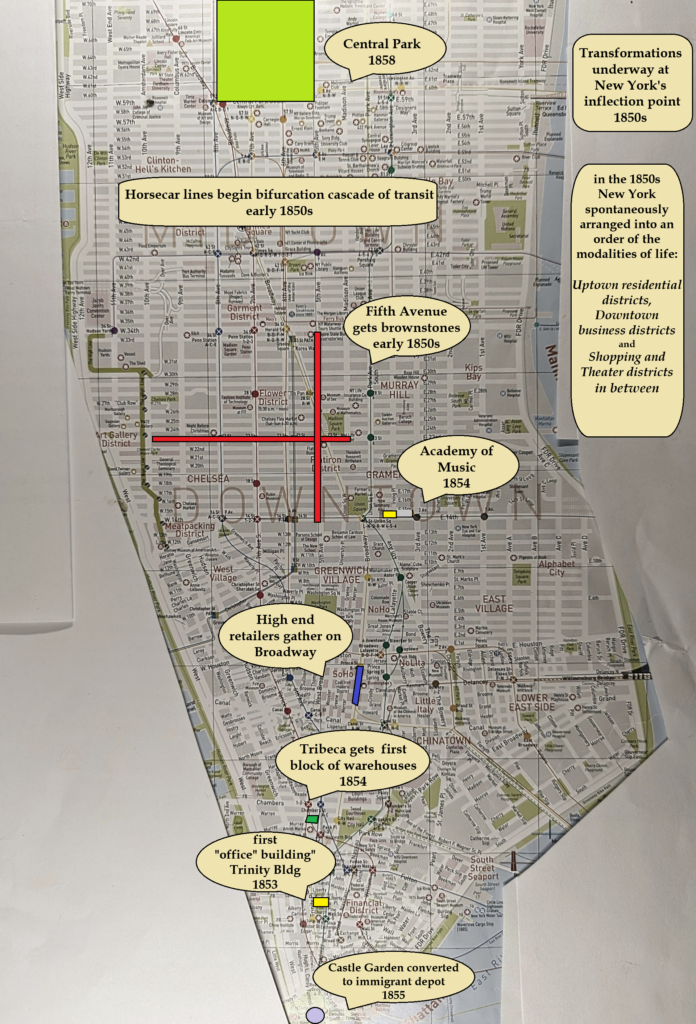
The history seems to indicate, however, none of it would have happened without the horsecar lines of the early 1850s.
Vaunting the success of Central Park in the 1860s, William Cullen Bryant (editor of the New York Post and Bryant Park namesake) asked, Can a City Be Planned? In fact, a decade prior the city had implemented a plan of its own.
The log graph below shows how New York’s historic inflection point brings structure, logic and order to the city’s growth and development. A bifurcation cascade of transit systems 25-30 years apart saw derivative cities replace one another in situ as the entire system expanded and grew uptown.
If you read my blog, thank you.
Stay safe and stay well.